Phases, WBS and tasks
Build the job from the top down. Set phases, a work breakdown structure, activities and tasks, then give each one an owner and a baseline.
- Projects
- WBS
- Activities
- Phases
- Tasks
- Subtasks
OConstruction is construction project management software that keeps your schedule, site reports, resources and costs in one place. Break a job into phases and tasks, assign crews, and see planned work against actual work as it happens.
No credit card. Cancel anytime. $24 per user per month after the trial.
A project manager touches the same eight things every day. They all live in one workspace here: structure, schedule, resources, reports, quality and risk.
Build the job from the top down. Set phases, a work breakdown structure, activities and tasks, then give each one an owner and a baseline.
Drag tasks on the Gantt when the weather turns or a delivery slips. Switch to the calendar to follow milestones.
Assign crews, materials and cost to a task, then compare planned use with what you actually spent.
Crews log progress, labor and photos from site. The office sees it the same day.
Run inspections, record snags and capture photos and video during site audits.
Keep comments and files on the task, not in a group chat that nobody can search.
Compare planned and actual progress, cost and quality in live dashboards.
Log a risk early, track the issue, and keep the plan to fix it next to the work.
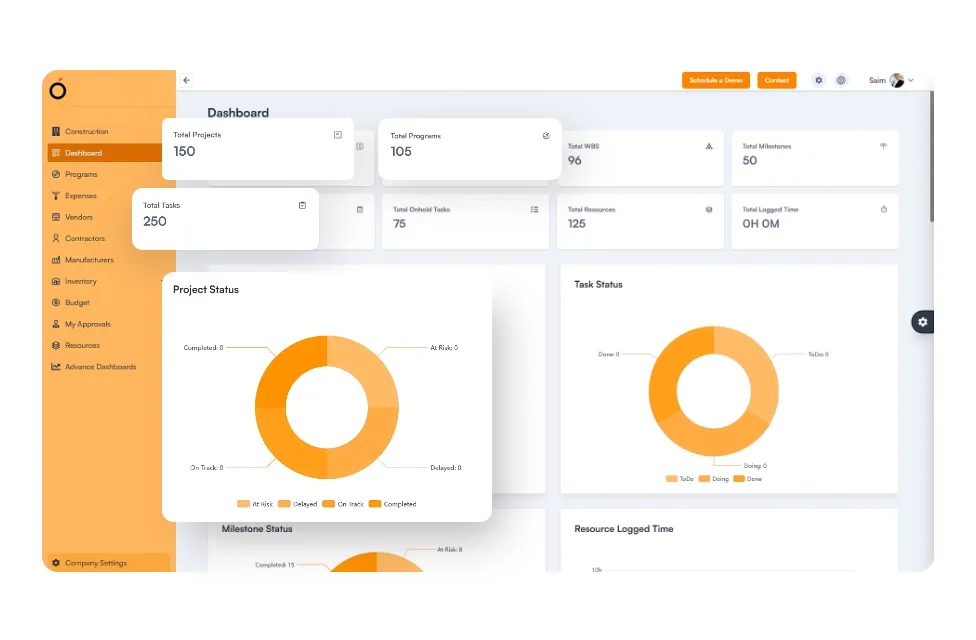
These numbers sit on the dashboard from day one.
Total projects
Planned vs actual progress
Cost variance and budget use
Resource use
Open vs closed inspections
Milestone completion rate
Quality and safety compliance index
You get one source for the plan, the field updates and the cost. Nobody has to reconcile three versions.
WBS, milestones and dependencies sit in a single view.
Field updates and cost show up while you can still act on them.
Every task has a person on it.
Inspections and observations link to the activity they check.
Reports answer the question before the meeting starts.
Updates, files and replies stay where the work is.
Here is what changes when the plan, the updates and the cost share a home.
Every module shares the same projects, people and data.
Common questions about construction project management software.