
Missed deadlines. Budget overruns. Communication breakdowns. In construction, the smallest misstep can have massive consequences. Yet many project managers still rely on gut instinct over real-time insights.
That’s where KPIs — Key Performance Indicators — step in.
In today’s high-stakes construction environment, tracking the right KPIs is the difference between a project that thrives and one that drains resources. With tools like OConstruction’s project management platform, construction managers now have access to real-time metrics that simplify decision-making and maximize results.
In this blog, we’ll walk you through the top 10 construction KPI you should be tracking, why they matter, and how an integrated digital platform like OConstruction makes it easy to stay on top of them.
Why Tracking Construction KPI Is a Game-Changer
Tracking KPIs isn’t just a reporting exercise — it’s a blueprint for project control, accountability, and predictable outcomes.
Here’s why it matters:
- Budget Blowouts Are Common: According to McKinsey, large construction projects often take 20% longer to finish and run up to 80% over budget.
- On-Site Visibility Is Limited: Without live data, managers can’t adjust to changes or delays quickly.
- Multiple Stakeholders: Owners, contractors, and subcontractors all need to be aligned — KPIs help everyone stay on the same page.
Use Case 1: Residential Developer
A mid-sized developer building 50 homes needed better cost tracking. Using KPI dashboards in OConstruction, they identified delays in procurement early and reallocated budgets before overruns occurred.
Use Case 2: Commercial Contractor
A firm managing office fit-outs improved crew productivity by tracking labor efficiency metrics across multiple job sites.
The result? Faster decisions. Less risk. Greater ROI.
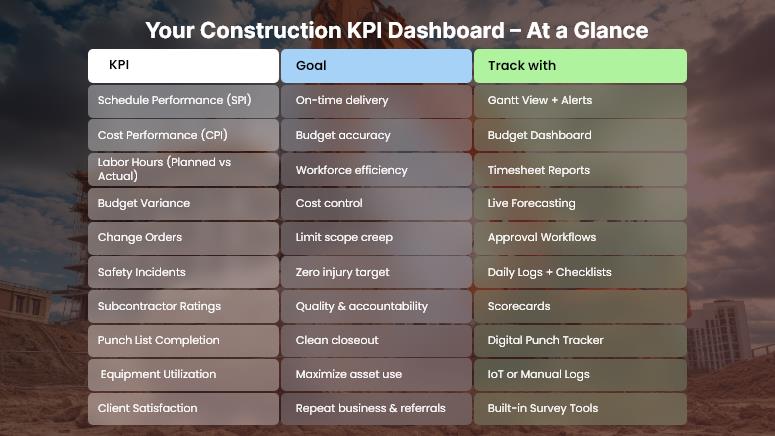
10 Must-Track KPIs for Construction Project Success
Here’s a breakdown of the top 10 construction KPI project managers should track, along with best practices for monitoring and improving them using tools like OConstruction.
1. Schedule Performance Index (SPI)
- What it is: Ratio of work performed vs. work scheduled.
- Why it matters: Spot delays and adjust timelines early.
- Tip: Use real-time Gantt chart tracking to visualize slippages.
2. Cost Performance Index (CPI)
- What it is: Ratio of earned value vs. actual cost.
- Why it matters: Reveals if you’re getting value from your budget.
- Tip: Link costs directly to your schedule to catch overruns.
3. Planned vs. Actual Hours
- What it is: Comparison of estimated labor hours to hours spent.
- Why it matters: Monitors team efficiency.
- Tip: Use timesheet integrations for accurate reporting.
4. Budget Variance
- What it is: Difference between projected and actual costs.
- Why it matters: Tracks whether you’re staying within budget.
- Tip: Set automated budget alerts inside your dashboard.
5. Change Order Frequency
- What it is: The Number of scope or design changes during a project.
- Why it matters: High volume signals planning issues or poor documentation.
- Tip: Tie change orders to approval workflows.
6. Safety Incident Rate
- What it is: Number of safety incidents per man-hours worked.
- Why it matters: Safety affects cost, morale, and legal risk.
- Tip: Use mobile checklists and daily logs to improve safety compliance.
7. Subcontractor Performance
- What it is: Quality, timeliness, and cost adherence of subcontractors.
- Why it matters: Poor performance derails timelines.
- Tip: Use scorecards and feedback loops in your platform.
8. Punch List Completion Rate
- What it is: Percentage of punch list items completed before project close.
- Why it matters: Affects project delivery and client satisfaction.
- Tip: Track punch lists digitally and assign owners to each task.
9. Equipment Utilization Rate
- What it is: Percentage of time equipment is in use vs. available.
- Why it matters: Idle equipment = wasted cost.
- Tip: Track usage via IoT integration or manual entry.
10. Client Satisfaction Score
- What it is: Feedback on how well expectations were met.
- Why it matters: Drives referrals and repeat business.
- Tip: Send post-project surveys directly from the platform.
Use Case Example: Suburban Commercial Builder
For example, BuildCore Group, a regional commercial builder, used OConstruction’s KPI dashboard to monitor project health in real-time. By tracking schedule performance, budget variance, and equipment utilization, they were able to complete a $2M office complex two weeks early and 5% under budget.
Here’s how:
- Set SPI and CPI alerts
- Linked material delivery to schedule milestones
- Used subcontractor scorecards to ensure timely execution
Key Takeaways
- KPIs help construction managers shift from reactive to proactive decision-making.
- The right construction KPI ensures visibility across labor, cost, safety, schedule, and quality.
- Tools like OConstruction make tracking, automating, and improving these KPIs easier than ever.
If you’re not tracking KPIs, you’re not managing projects — you’re guessing.
FAQs
Q1. What are KPIs in construction project management?
KPIs (Key Performance Indicators) are measurable metrics that help project managers track progress, costs, safety, and performance to ensure projects stay on time and within budget.
Q2. Why should construction managers track KPIs?
Tracking KPIs reduces budget overruns, improves schedule control, increases accountability, and ensures all stakeholders work toward the same goals.
Q3. Which KPIs are most important for construction projects?
Some critical KPIs include Schedule Performance Index (SPI), Cost Performance Index (CPI), budget variance, labor efficiency, subcontractor performance, safety incident rate, and client satisfaction.
Q4. How do KPIs help prevent project delays and cost overruns?
By comparing planned vs. actual performance, KPIs highlight issues early—such as labor inefficiency, equipment underuse, or cost overruns—so managers can take corrective action quickly.
Q5. Are KPIs only useful for large projects?
No. KPIs are valuable for all construction projects, from small residential builds to large infrastructure projects. The scale may differ, but the insights apply everywhere.